Interpreting State of India’s Birds Results
Table of contents
FAQ #
Who are the people and organizations behind SoIB?
SoIB is published by the State of India’s Birds Partnership: a group of 13 government and non-government organizations. All individual contributions to the various sections of the report are acknowledged in p118. The assessments of priority status at the national and regional levels are based on the observations of over 30,000 bird-watchers uploaded to ebird.org/india.
Which are the bird species included in SoIB?
What results are available for bird species in SoIB? And what data are they based on?
A number of results are available at the country, mask and state levels. These include, for certain species within each region, estimates of Long-term Trend, Current Annual Change, and Range size, each with measures of uncertainty (link to ‘main’ file). These terms are explained below.
Long-term Trend: This is the change in the index of abundance (frequency of reporting) in 2022/23 relative to “before 2000”. A value of -15% indicates that there has been a 15% decline in frequency of reporting over that time period.
Current Annual Change: This is the average annual change in frequency of reporting from 2015/16 to 2022/23. A value of -3% indicates that there is an average annual decline of 3% in frequency of reporting over this 7yr time period.
Distribution Range Size: This is the estimated area within India that the species occupies. It is based on actual reporting locations, supplemented by an estimate of the area over which the species might occur, even though it has not yet been reported yet.
CI: This refers to the 95% Confidence Interval, which is a measure of the uncertainty in any estimate. All estimates shown here should be interpreted taking into account their uncertainty. For example, if the estimate of Distribution Range Size is 200,000 km and its CI is 5,000 km then the best guess is that true Range Size is somewhere between 195,000 km and 205,000 km. Similarly, if the estimate of the Long-term Trend is -15% and its CI is 5% then the best guess is that the actual Long-term Trend is somewhere between -20% and -10%.
Within each region, species are also separately categorized based on each metric, and given an overall Priority Status (see p102 in the report). The website also has trend graphs available for each species with an estimated trend, both at the national level and at any applicable regional level. Finally, range maps are available for each species at the national and state levels (see more about trends and range sizes, and refer to the report (link)).
In the report (see p20), key species for each state are listed.
How is distribution range size categorised at the state level?
Can these results be downloaded?
Yes, these results can be downloaded from the website. A compilation of important results (those listed in the previous section) can be downloaded [coming soon]. Additionally, every species has a page on the website from where any relevant trend graphs and range maps can be downloaded.
Raw trend and occupancy estimates from the statistical models are also available for download, but not yet from this website. Please write to us if you require this information.
Is SoIB conservation priority different from IUCN threat status? If so, how is it different?
Yes, they are different.
IUCN threat status, popularly known as the Red List, is a global assessment of the extinction risk of every species. For birds, this is updated and maintained annually by BirdLife International. They follow a set of five criteria that is common across all forms of life. Unlike India, some countries also have a national level Red List—the extinction risk of a species within the political boundaries of a nation. IUCN recommends using both global and national Red Lists to arrive at conservation priorities for the birds in a country.
SoIB is an independent assessment of the birds based on criteria different to those used by IUCN. SoIB Priority Status for a species is based on its abundance trends and distribution range size. In some cases where abundance trend data was unavailable, the global threat status from IUCN was also used to inform the SoIB conservation priority. Regional assessments like SoIB also help inform the IUCN global threat status.
How is SoIB conservation priority determined for each species?
SoIB conservation priority for my species of interest has changed from SoIB 2020 to SoIB 2023. Does this mean its status has changed on the ground?
No, except in perhaps a few cases. Direct comparisons of the results of SoIB 2020 and 2023 are difficult due to differences in data and methods (see next section and p18 in the report). A deeper investigation is required to deduce cases of genuine on-ground change in status.
Comparing results of SoIB-2020 and SoIB-2023 #
More data
SoIB 2023 is based on 30 million unique observations whereas SoIB 2020 was based on 10 million observations. This increase in data is not just in the period that followed SoIB 2020 but also for past years as many more birdwatchers retrospectively digitized historical data lying in notebooks.
Updated algorithm
An important new methodological update in SoIB 2023 is the inclusion of a step to further reduce “spatial bias”. For each of 1000 iterations for each species, its trend analysis is performed using only a single (randomly selected) representative checklist from each unique location/site within each time-period. This reduces the impact of sites that have more birdwatchers visiting on the overall trend.
Updated rules for conservation prioritization
The Current Annual Change now has a greater impact on the conservation priority than the Long-term Trend. This change was brought in because of the relatively greater confidence we have in recent trends due to a larger available dataset.
Abundance trend graphs #
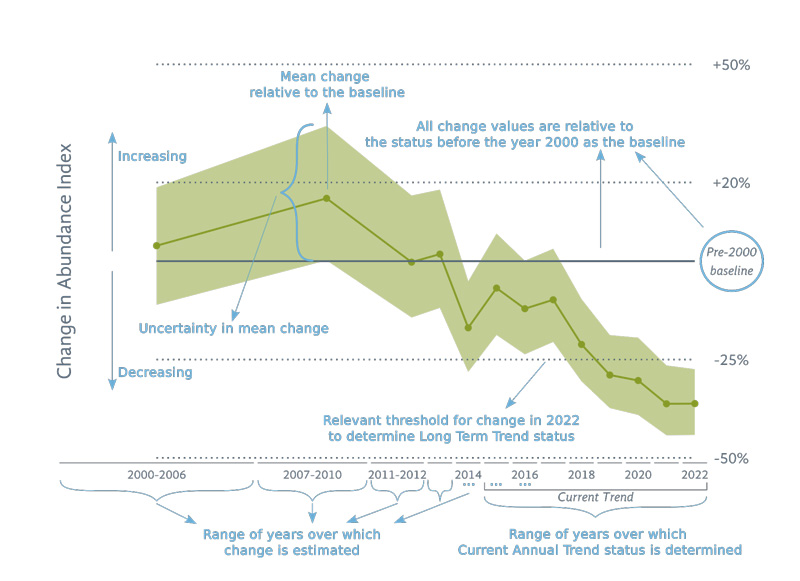
The value for every time-period represents the percentage change in the Abundance Index (frequency of reporting) of the species in that year relative to before the year 2000 (baseline). In the graphs, the shaded area represents the uncertainty (the 95% confidence interval). See the State of India’s Birds 2023 report for more details.
State OR Habitat OR Conservation Areas
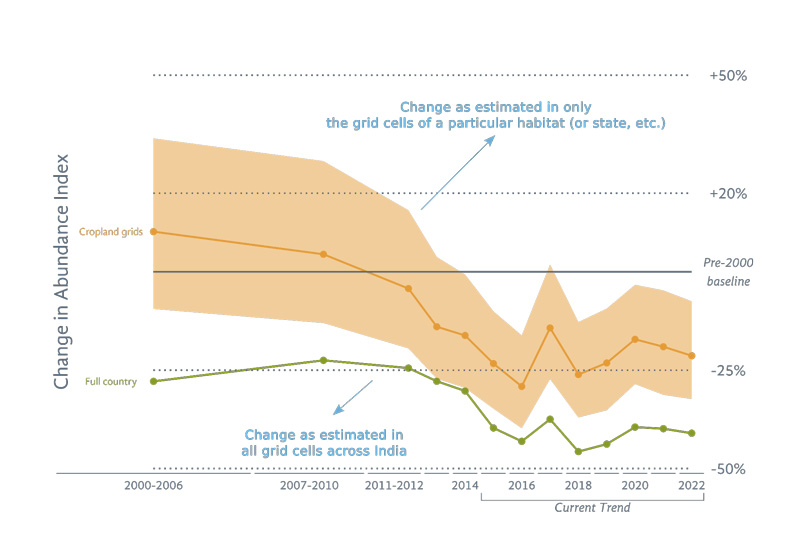
The trend graph for a state OR habitat OR Conservation Area is shown with its 95% confidence interval. The national trend, if not ‘inconclusive’, is represented by its mean trend line and shown alongside for comparison. Details of these specific values are available for download here.
Distribution range maps #
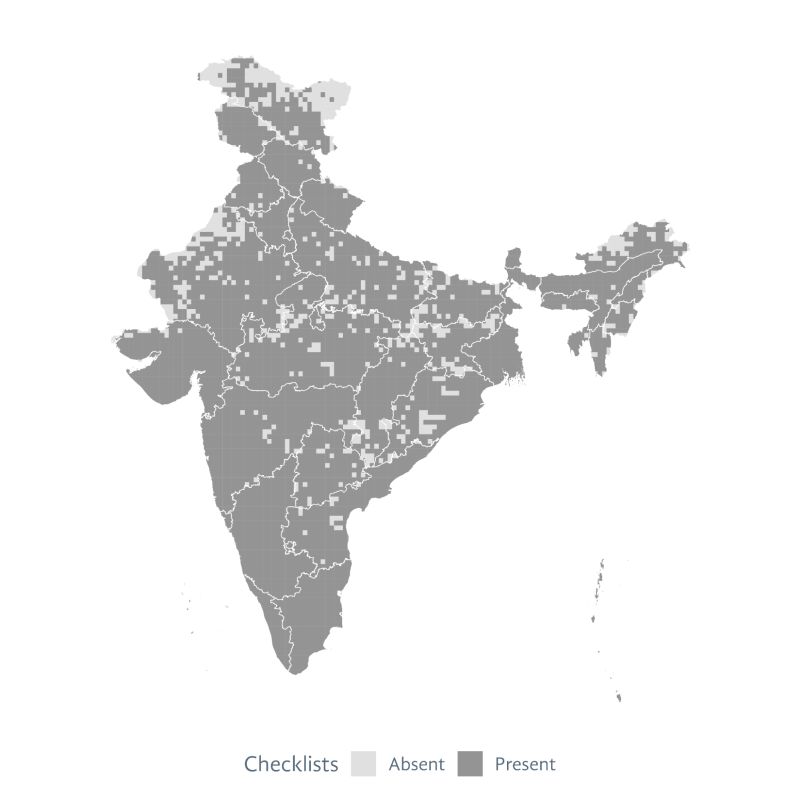
The map represents the recorded and likely current range of a species, as assessed from eBird reports between 1 June 2018 and 31 May 2023. The cell size is 25 km × 25 km; at this resolution, only 979 of 6253 cells (16%) in India lack any information. All cells where the species was reported are shaded with opaque colour. Neighbouring cells are shaded with increasing opaqueness with increasing likelihood of occupancy from a statistical model. For migratory species, only cells where the species has been reported ‘regularly’ (during three or more years in the five-year period) are shaded in dark colour. All other records are represented by × to indicate that the species has not been regularly reported there. A cell is considered part of the summer range of a species if it has been ‘regularly’ reported from within the cell during the period from 25 April to 5 August. Similarly, winter range is determined by the regular presence of the species between 20 November and 1 March but not during the summer. A cell is considered part of the Spring/Autumn range of a species if it has only been regularly reported outside the summer or winter.
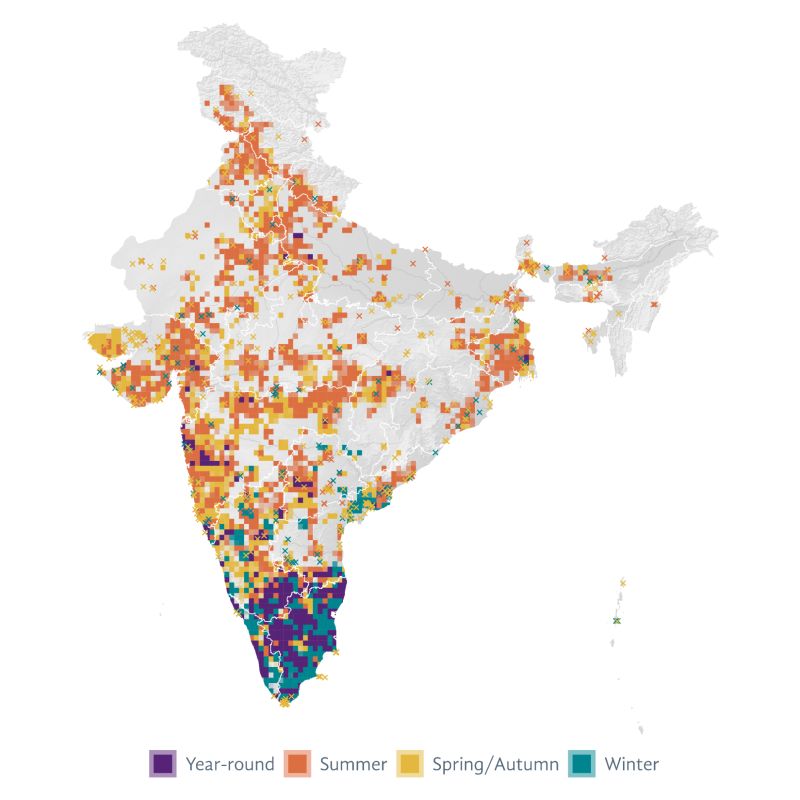
Similar maps are available for India’s states. These are nation-wide maps clipped to the state while taking care that edge cells are only filled when the species is recorded from within that state boundary.
Such maps are not available for protected areas and habitats because they do not form contiguous spatial units.
| Field Name | Description |
| English Name | English name of species in India Checklist v7.1 (https://indianbirds.in/india) |
| Scientific Name | Scientific name of species in India Checklist v7.1 (https://indianbirds.in/india) |
| SoIB 2023 Priority Status | Conservation Priority Status of species from SoIB 2023 national-level assessment |
| SoIB 2023 Long-term Trend Status | Long-term Trend Status of species from SoIB 2023 assessment |
| SoIB 2023 Current Annual Trend Status | Current Annual Trend Status of species from SoIB 2023 assessment |
| SoIB 2023 Distribution Range Size Status | Distribution Range Size Status of species assigned from SoIB 2023 assessment |
| eBird English Name 2022 | English name of species in eBird/Clements Checklist 2022 |
| eBird Scientific Name 2022 | Scientific name of species in eBird/Clements Checklist 2022 |
| BLI English Name 2022 | English name of species in HBW/BLI Checklist 2022 |
| BLI Scientific Name 2022 | Scientific name of species in HBW/BLI Checklist 2022 |
| Order | Taxonomic Order to which species belongs |
| Family | Taxonomic Family to which species belongs |
| Breeding Activity Period | Breeding period of species, based on Wilman et al. 2014 |
| Non-breeding Activity Period | Non-breeding period of species, based on Wilman et al. 2014 |
| Diet Guild | Diet guild of species, based on Wilman et al. 2014 |
| Endemicity | Endemicity of species adapted from India Checklist v7.1 (https://indianbirds.in/india) |
| Endemic to India | Whether species is endemic to India |
| Endemic to Subcontinent | Whether species is endemic to the Indian subcontinent |
| Endemic to Himalaya | Whether species is endemic to the Himalaya |
| Habitat Specialization | Habitat specialization of species, based on Wilman et al. 2014 |
| Migratory Status within India | Migratory status of species within India, assigned based on multiple sources |
| Restricted to Islands | Whether species is restricted to the islands of India |
| IUCN Category | IUCN threat status category of species, based on India Checklist v7.1 (https://indianbirds.in/india) |
| WPA Schedule | WPA Schedule of species, based on India Checklist v7.1 (https://indianbirds.in/india) |
| CITES Appendix | CITES Appendix category of species, based on India Checklist v7.1 (https://indianbirds.in/india) |
| CMS Appendix | CMS Appendix category of species, based on India Checklist v7.1 (https://indianbirds.in/india) |
| 1% Population Threshold | Wetlands International estimate of the 1% biogeographic population size (individuals) of a waterbird species |
| Selected for SoIB | Whether species was selected for SoIB 2023 analyses |
| Selected for Long-term Trend | Whether species was selected for Long-term Trend analysis in SoIB 2023 |
| Selected for Current Annual Trend | Whether species was selected for Current Annual Trend analysis in SoIB 2023 |
| Long-term Trend LCI | Lower limit of 95% confidence interval of modelled estimate of the change in abundance in 2022-23 relative to pre-2000 values (see p102 of SoIB 2023 report) |
| Long-term Trend Mean | Modelled estimate of the change in abundance in 2022-23 relative to pre-2000 values (see p102 of SoIB 2023 report) |
| Long-term Trend UCI | Upper limit of 95% confidence interval of modelled estimate of the change in abundance in 2022-23 relative to pre-2000 values (see p102 of SoIB 2023 report) |